The Bureau of Metrology site is an iconic Australian resource with a cult following, used and relied on by millions of people each day.
Contribution
User research, Information architecture, wireframing, Visual design direction
Contribution
August 2019 - May 2020

Project context
For broader context, the redesign of the Bureau’s site was broken up into two major phases, research and design. The research phase focused extensive quantitive studies, understanding and collating key pain points, defining archetypes and mapping out a refined version of the sites IA. While the design phases focused on the end to end experiences for particular archetypes, depending on their most commonly completed tasks.
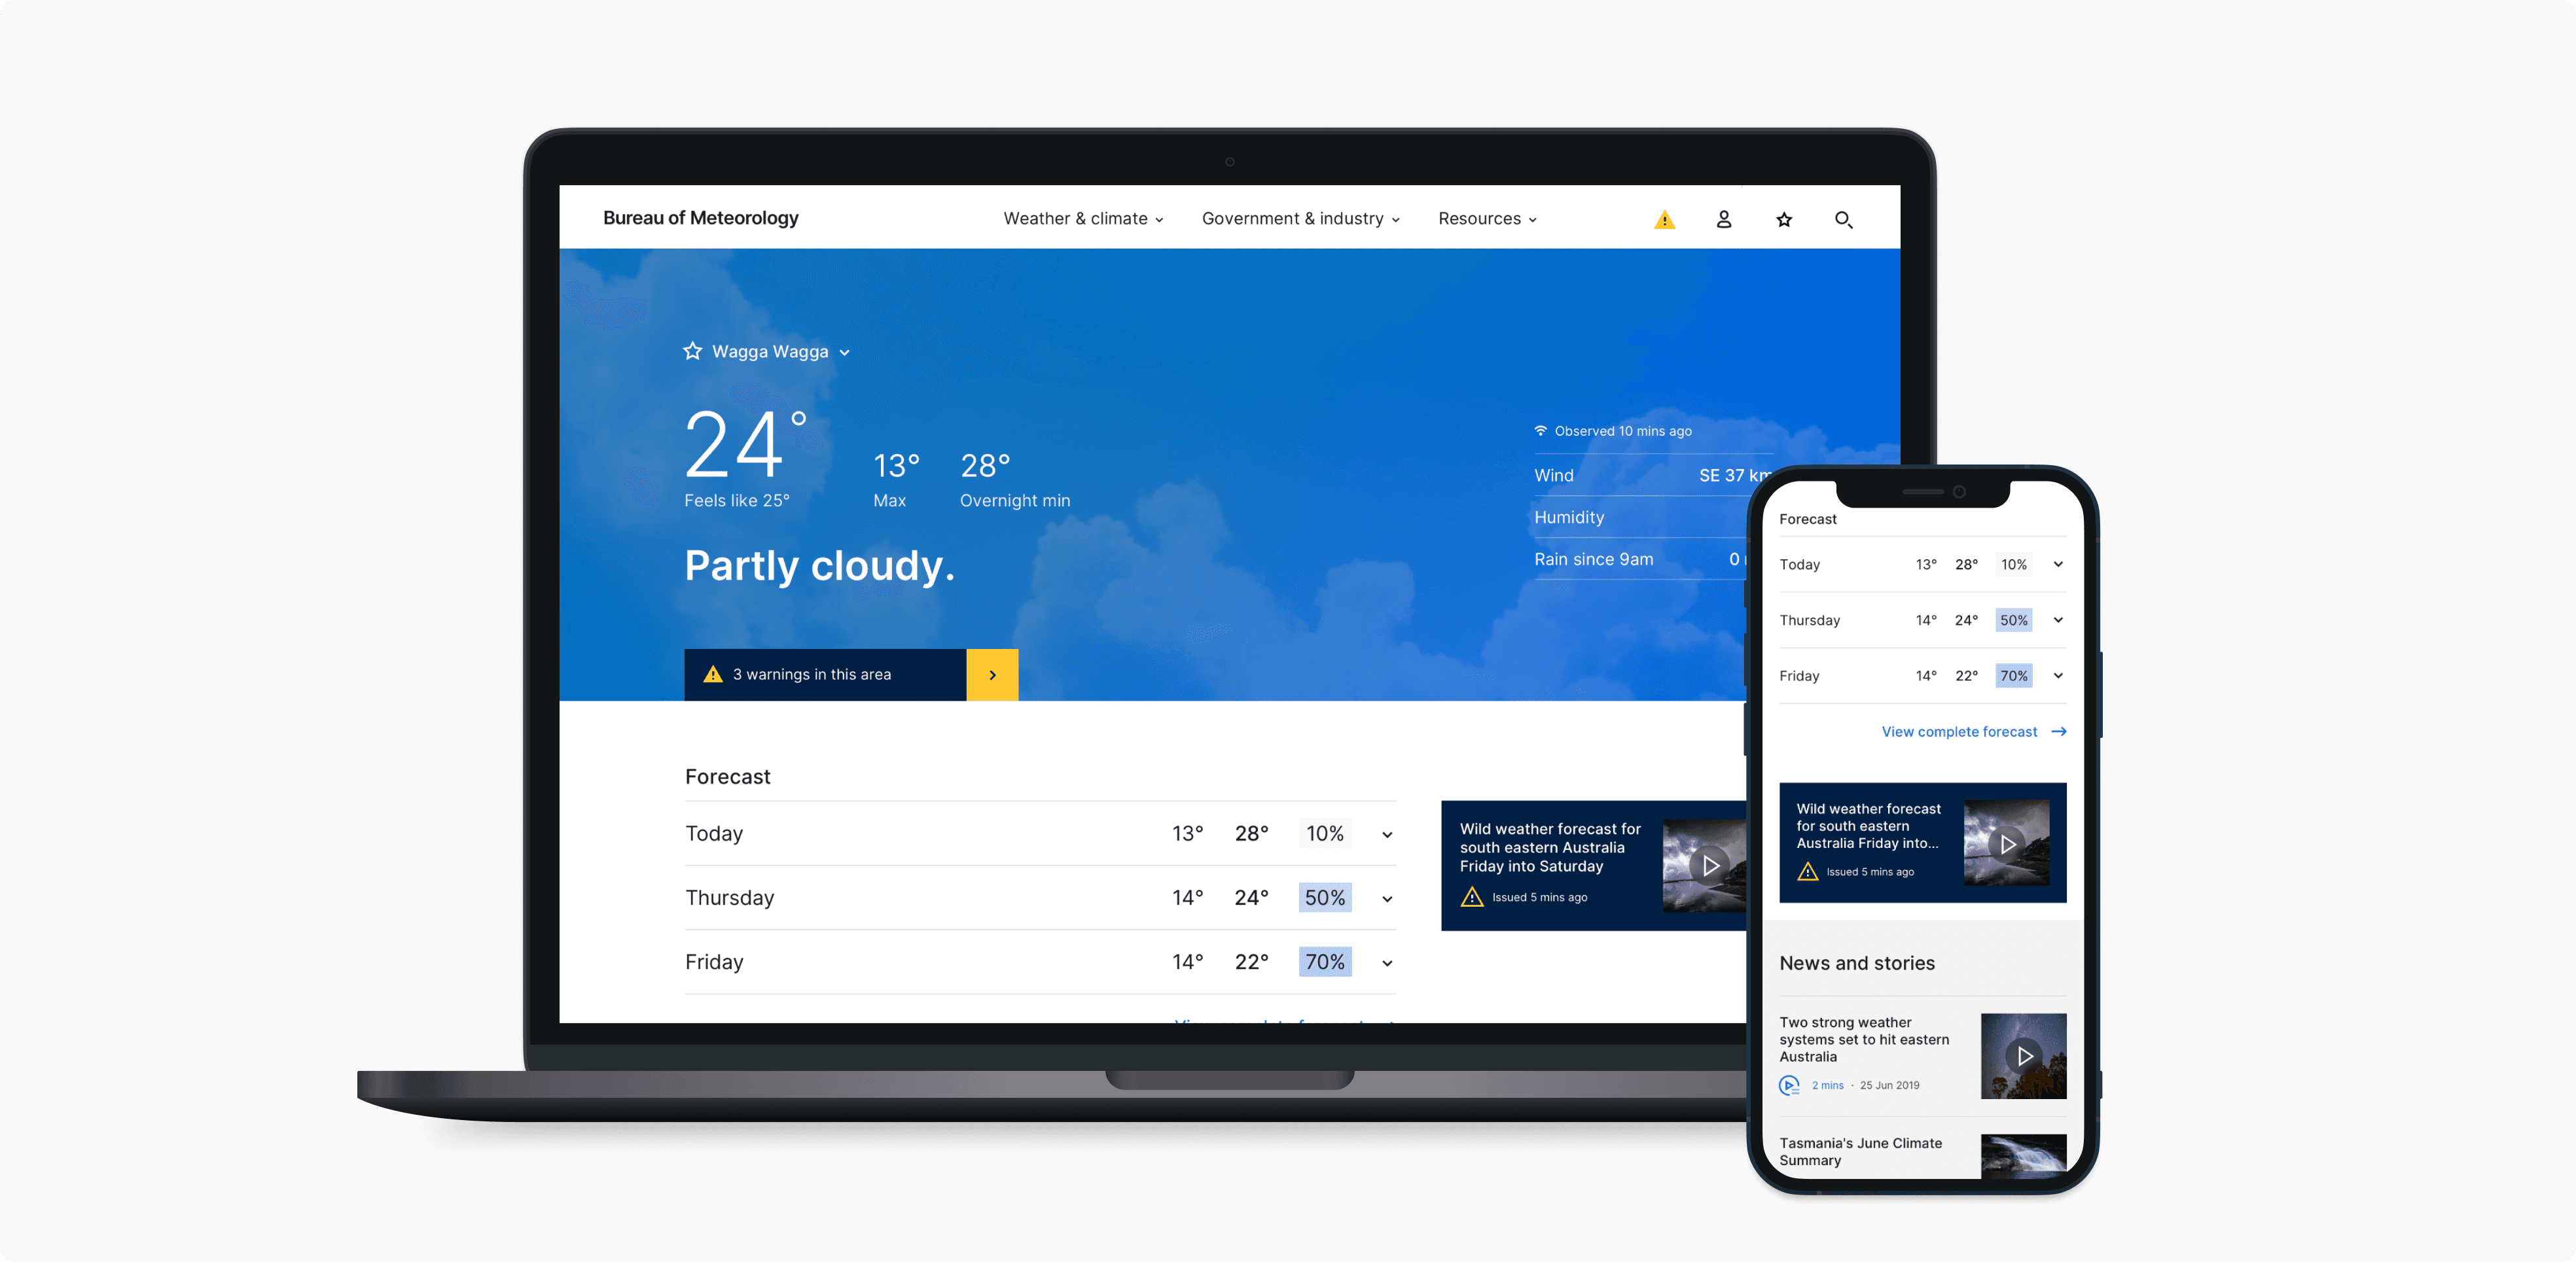
My role as part of design phase focused on the end to end redesign the landing and observation pages, among many other pages. This case study will cover my process from rough low-fidelity sketching through to high fidelity prototypes and usability testing to understand if the updated designs hit key metrics around, discoverability, navigation of end to end flows and user satisfaction.

Problem definition
We had tight timelines to complete a large volume of work and almost limitless design flaws and usability issues that we could focus on, so getting buy in around the key problems to solve from the start was critical.
Through a series of workshops, and prioritisation activities with the Design team at the Bureau, we agreed on the largest pain points that we wanted the updated designs to solve for, as well as our measures of success for those outcomes. This process provided a collective view of success for the designs, that meant that we could make focused design quickly and not get sidetracked with subjective takes.
Below is a summary of the priorisied design problems to address as part of the process, as well as the metrics we would use to measure their success
Takes too long to find localised information
Can’t see key information like daily and hourly forecast at a glance
Information is too dense, its difficult to understand where to focus
Rain radar (most used feature page based on analytics) is too difficult to access for my location